I completely forgot to upload the talk as I needed to cut out some company internal bits and edit to not show my team’s avatars. I finally got to doing this and you can see the video below.
In my previous article I gave an introduction to LIDAR for archaeology. This article aims to take you one step further. It shows an example of processing real world LIDAR point clouds for archaeology, in order to create a digital surface model (DSM).
In today’s example we will be looking at LIDAR data for Tikal, a Mayan city located in Guatemala. This city flourished between 200 and 850 A.D, and became the home to Temple IV, the tallest pre-Columbian structure in the Americas.
We will be going from site, to point cloud, to digital surface model (DSM) in a few steps. Well, today we will skip the first step of actually generating a point cloud as we would need some equipment as well as the ability to go outside for that, but you get the point (pun intended).
Tikal is mapped to a point cloud using LIDAR, then the LIDAR point cloud is converted to a Digital Surface Model (DSM)
Preparation
In order to get started, you will need to setup the following.
You only need wine if you are on a mac. If you are on windows then:
You don’t need wine
The references to the environment variables would use opening and closing ‘%’ instead of a starting ‘$’
If you are on Catalina “wine” will be “wine64” instead
LAS_DIR refers to the directory where you have downloaded LASTools to
HIVE_DIR is the directory where your data is
Processing
You are now ready to start. The first thing that we need to do is convert the .e57 file to a .las (or .laz) file for us to be able to process it further. We can do this as follows:
In the case of the Tikal data, there has been some colouring added to the points to make the items identifiable. We can see this in the screenshot below, however other sources would likely not have such colouring.
Point cloud visualisation
You can find out information about the point cloud by running lasinfo.
This will output all kinds of information about your point cloud, including the number of returns, classifications, angles, etc. You can use this command to extract information at various points in your pipeline in order to analyse changes caused by it.
Example output of lasinfo
We can see in the above information that none of the points have been classified. In order for us to clean up the point cloud to have a nice DSM at the end, we need to know what kind of surface each point represents, and therefore need to classify these. The first step to classification is identifying which points form part of the ground, which we can do as follows:
Note that we use the “archaeology” option. This has some default parameter configurations that in general work well for archaeology. The lasgroundcommand has other options that also allow you to tune the process further, should your use case need such further tuning. Next we need to calculate the height of every other point in relation to the ground using lasheight.
The extra parameters “small_buildings” and “small_trees” tell the process to not exclude small buildings and trees from the classification. Without these options, the algorithm would leave them as “unclassified”. The option “step” refers to the step size in meters, which affects the thresholds used by the classification algorithm and is tuned based on how dense your cloud is.
Now that the points are classified, we are ready to start working on the DSM. Before we go further with these steps, let’s see what a DSM would look like without cleaning any of the data.
Uncleaned DSM
That’s not very nice. It is graney, only the large buildings are more or less identifiable, and it reveals nothing that we couldn’t see in the point cloud version of the same site. We would have a better time with a high definition satellite image than with this DSM.
The first step to fixing this is to remove noise. We can think of noise as points classified as one thing within a large group of points classified as another. We do this cleaning as follows:
The parameter “isolated” states how many points need to be be alone within the “step” size of 2 meters in order to be considered to be noise. For denser clouds, or larger step sizes, this value would likely be larger than for scarce ones. The parameter “remove_noise” removes the points identified as noise from the point cloud Without the “remove_noise” parameter, the resulting point cloud would still contain noise that has simply been classified as such.
In order to create the DSM, we want to reduce the number of points that are being drawn. This helps us make a smoother and less graney image. To do this, we use the thinning process, tuning the step size in order to smoothen it further.
In our use case, we want to only keep points classified as building and ground. Therefore, we need to drop classes 5 and 1, which are “vegetation” and “unclassified” respectively. Of course, depending on your site, you might need to drop other classes too. You can see what types of points exist in your laz file by running lasinfo after lasclassify. The classes are number based, and you can see what each one means in this documentation.
The parameter “hillshade” adds shading to the resulting image, “kill” excludes triangles with edges longer than 10 in this case, and “scale” multiplies all elevation values by the given amount. All these parameters are defined by experimenting until satisfied with the resulting DSM, which in our case we can see below.
Clean DSM
This is a much more pleasant and smooth DSM. It reveals parts of buildings previously covered by vegetation, new staircases at the top, and smaller buildings that were previously not visible next to the right hand side pyramid.
That’s it folks, that’s how you can get started with lastools to process archaeological LIDAR data. I am sure that professionals in this field can get an even nicer DSM, but I hope that you have learned at least some basics through this post. If you want to try out some other tools, it may be worth exploring:
If you read this blog often, then you have probably already seen some or other article about LIDAR being used in archaeology. This article aims to give you a proper introduction to the technology and its applications in archaeology.
What is LIDAR
LIDAR stands for Light detection and Ranging. It is a method for measuring distance using light. Take the image below as an example:
A sensor is attached to an airplane. Laser light is shot down, bouncing off various types of surfaces. We can measure distance to an object based on how long it takes for the light to bounce back.
The output of this exercise is called a point cloud. You can think of it like a 3D model made out of dots, where each dot represents a point that the light hit. Here is a visualisation of a point cloud representing a mountain. The colours represent the height of the point in relation to the ground:
Properties of the returning light, such as the intensity for example, differ based on the kind of surface that was hit. This kind of information allows us to classify each point in order to identify vegetation, buildings, water, etc.
Once you have a point cloud, you can further process it to output different kinds of artefacts. Out of these, the following have applications in archaeology:
3D model: By filling the gaps between the points we can create a 3D model. This can be useful to preserve/document a building in virtual form.
Digital surface model(DSM): A digital terrain model (DTM) allows us to see what the ground looks like under the vegetation, buildings, etc. A digital surface model (DSM), on the other hand, is a DTM that allows us to keep certain objects identified above the ground. It is often used in archaeology to reveal what buildings look like under thick vegetation, as the laser’s light can go through the holes in between the leaves, hitting whatever may be underneath.
Raster: You can think of a raster as an image with geographical data. You could, for example, output a raster from a LIDAR point cloud, which outlines the shape and location of some archaeological remains.
Insights: The outputs of the processed point-cloud do not need to be limited to visual options. LIDAR can be used to gather insights as well, whose output type can vary. In archaeology it can be used to detect changes in a site (e.g. looting), output distance metrics, etc.
Where to find data
Now that you know what you can do with LIDAR, it’s time to talk about how to get the data.
Depending on what you want to do, you may be able to find some data online. These sites provide open data access for research purposes:
Open topography: The site is mainly focused on the USA with some datasets from other countries. One archaeological dataset found here is the Caracol/Chiquibul Belize Lidar dataset.
Cyark: The site is focused on the digital preservation of cultural heritage. Some examples of LIDAR point-clouds of archaeological sites available here include Tikal and Ayutthaya.
Carbon Atlas: This site also provides open access to LIDAR scans for Southern Africa. Note that the scanning was focused on forestry and environmental topics.
USGS: Collection of worldwide data for multi-disciplinary scientific applications.
NASA: NASA has used satellite LIDAR to map our planet (and others). Note that satellite LIDAR is probably not good enough for your archaeological use case as the resolution will not be good enough to pick up things like buildings. However, I am still adding it here as maybe you get creative and want to try something out 🙂
Screenshot of Cyark site
Chances are that the area that you need has not been surveyed yet, or it is not part of these open data initiatives. In this case, you’d need to do the mapping yourself. Fear not, you have a few options:
Hire a company: There are companies that you can hire, which have the pilots, airplanes, sensors and experts to do a LIDAR scan for you. If you need to do the scan once (or maybe once a year) this is probably your best option, as it requires no up-skilling into the intricacies of the hardware. One example of such a company can be found here.
Buy/rent a drone/robot: It may be that you will need to rely on doing LIDAR scans quite often for your use case, and therefore need to be able to do so on demand. You have the option of buying/renting a drone/robot in this case. One thing to note here is that you’d need to up-skill your team, or hire an expert, in order to do the configuration of the hardware. This is because the configuration can differ based on what is being mapped. One example of such a drone can be found here.
Buy a handheld LIDAR device: It may be that you are not looking for an aerial scan specifically, but rather for a more close range ground-based 3D scan of a site. You can look at handheld or tripod based LIDAR options in this case.
Build your own scanner: The sensor itself is not expensive, so if you are into building hardware this may be an option for you. Here are some examples of LIDAR sensors that can be bought, an example of a development kit for LIDAR, and another on how to build your own scanner from scratch.
Like with any dataset, the transformations that you will need to do on your point-cloud will differ depending on 2 things:
What the point-cloud is of: is it a forest, a desert, a city, etc.
What you plan to do with it: create a 3D model, reveal buildings under vegetation, etc.
While I transformed some of these point-clouds myself I found four transformations that seemed to come up in all my experiments, and which you will most likely need to do. The four were:
Identifying the ground points: this gives us a baseline in relation to which the location of the other points can be defined.
Computing the height of the points: Now that we have the ground as a base, the height of each point can be computed in relation to the ground. This allows us to have a common representation of distance between points.
Classifying the points: Each point represents a surface that was hit by the laser. The properties of the returning light allow us to classify points to be buildings, water, vegetation, etc. The LIDAR tooling available for us already does the classification through existing algorithms, allowing you to focus your work on experimenting with the available parameters to fit your use case. That said, it may be that the algorithms available are not good enough for what you need, leading to you into the deep trenches of LIDAR data to create something custom.
Cleaning the noise: You can think of noise in point-clouds as isolated points. For example, points representing particles in the air are irrelevant when looking for buildings under vegetation, and are rather sparse. Additionally, if you have 2 points classified as building in a group of 20 vegetation points, for example, these buildings are probably miss-classifications.
Alternatives to LIDAR
As with any tool, depending on what you want to do, there may be an alternative technology that can cover that use case. For LIDAR in archaeology, two alternatives that come to mind are as follows:
Photogrammetry: If you are creating a 3D model and don’t have overgrowing vegetation to remove from your scan, you can create a 3D model using photogrammetry instead. You can also combine laser scanning with photogrammetric methods to get an even more accurate representation of the site, just like the team at the Zamani Project does.
Satellite imagery: If you are looking to create some sort of raster output, satellite imagery might already cover your use case and it is a lot more accessible than LIDAR data. If you want to learn more about the use of satellite imagery in archaeology, check out this previous post.
That concludes part 1 of this topic. I decided to play with some tools and see if I could create a Digital Surface Model of the Tikal data that I found on Cyark. This process has been detailed in Part 2.
I recently read Sarah Parcak’s “Archaeology from Space: How the Future Shapes Our Past ” and enjoyed it. It inspired me to take a closer look at remote sensing in archaeology, mentioned previously in this blog, but not really expanded upon. I thought it would be good to summarise a few learnings from the book itself, as well as from my personal digging into the topic.
Space archaeology, in this context, refers to the use of satellite imaging for applications in archaeology. These applications include, but are not limited to, identifying new sites, identifying looting pits, change analysis of a site (e.g. before and after looting), etc. You may also hear of it referred to as remote sensing in archaeology.
How to get the data
We have a variety of satellites orbiting the earth, each providing a variety of measurements. The most useful kind of satellite data for archaeologists is high-definition multi-spectral data. High-definition refers to how small an area each pixel in the image represents (e.g. 50cm), whereas multi-spectral refers to it containing different frequency bands. The high resolution imagery allows archaeologists analyse visible differences in vegetation (crop marks), soil colour (soil marks) and elevation (through shadows), as well as pin point sites on the surface from above. The additional bands allow archaeologists to highlight certain elements in the environment, such as vegetation health, soil composition, moisture, heat, etc, which can in turn bring to light the existence of a site that is not so easily identifiable by the naked eye.
High-resolution satellites are generally part of the private domain. Therefore, gaining access to such data can be expensive. Some high resolution satellites include:
Skysat [80cm resolution] – A commercial satellite. There are, however, some freely available areas accessible via Google Earth Engine for research and educational purposes. You can contact Planet to purchase access to your area of interest.
Pleiades [50cm resolution] – A commercial satellite which you can easily access using the Up42 platform (which includes a limited set of free credits to get you started). Alternatively, you can purchase data outside of the platform by visiting this link.
There are various free satellite image sources which are not high resolution. Should your use-case be covered by a lower resolution, you can check out:
Nasa – just a warning, the data dumps are huge as there is very limited filtering available. I played with some of their LIDAR data and there was a lot of waiting for downloads involved.
This is something that takes years of study, but for those wanting to get started, like me, this section aims to summarise some useful tips found along the way. First, take a look at GlobalXplorer. This is a platform that teaches the public how to identify loot pits and archaeological sites in order to crowd source the labelling of satellite images. As sites will look differently based on the environment (vegetation, soil, moisture, etc) and materials used to build the sites, there is no “one fits all” tutorial. Each campaign will provide a tutorial, as well as feedback on your selections, based on what others have selected for an image. It is a great way to satisfy your inner explorer whilst making an actual difference, by providing information needed to protect sites from looting.
Next are a couple of points worth considering when trying to analyse satellite imagery for archaeological sites. Note that these will be stated in rather general terms, as there are no globally applicable rules. Different environments require different approaches.
Time of day matters when analysing satellite imagery. For example images taken in the morning could reveal more features than those in the afternoon, due to additional moisture.
The season matters when analysing satellite imagery. For example, images from summer or early fall could show maximum differences in vegetation health.
Understanding the landscape, its geology, and the building materials available in that environment helps select the appropriate analysis tools (e.g. infrared bands, temperature, etc) in order to identify features.
Crop marks are differences in vegetation visible from above. Vegetation will grow faster, slower or not at all depending on what is beneath the ground. These can be visible in high definition images, but can be enhanced by looking at the different bands, such as infrared.
Soil marks are like crop marks, but on soil. Soil will have a different composition depending on what it contains. For example, soil that contains organic materials is often darker, which can point to things like burial grounds.
What works well in one part of your image might not work well across the entire thing. Therefore, you may need to combine different techniques side by side in order to get a complete picture of the features of the area.
I’ve mentioned multi-spectral data above. However, Hyper-spectral data can also be used, which is just like multi-spectral data but with a lot more bands. Such data allows archaeologists to identify distinct activity areas on archaeological sites, because it provides information about chemical composition, mineral content, etc.
To identify looting, you need to look for multiple 2-5 meter rounded pits grouped together. You can also look for disturbances in the landscape, such as evidence of machinery (e.g. bulldozers) or exposed archaeological features (e.g. a wall)
Tooling
Here are various tools that can help you in your satellite analysis journey:
ER Mapper – This is the paid tool mentioned in Parcak’s book.
ArcGIS – ArcGIS for personal use is a free version of ArcGIS pro. So if you are playing around, this may be an option for you.
Lastools – If you are specifically looking at aerial topograhical LIDAR data, this tool is more appropriate for you. It is mainly command line based, but it does have a very simple UI available. I’ll be going into LIDAR data in a bit more detail in a future post, as it was not really the focus of this one, so don’t worry if this seems out of place for now 🙂
Brief outline of Parcak’s book
This section is for those interested in reading the book from which most of the learnings in the “looking for archaeological/looted sites” section above came from. The author is an archaeologist, and founder of GlobalXplorer, who has used satellite imaging on multiple sites in order to find buildings or evidence of looting. On a high level, the book is structured as follows:
Explanation of what space archaeology is and the history behind it.
Stories of the author’s various archaeological expeditions and the role that satellite imagery investigations have had in those. One thing that I really liked about these, other than the stories themselves, is that Parcak discusses successful cases as well as those which didn’t go so well.
Descriptions and references to other technologies currently used in archaeology (ROVs, photogrammetry, etc). If you have read this blog a few times before, you will see a lot of familiar names.
Mentions of some tooling available for archaeologists (satellites, processing software, open datasets, etc). These are spread across the book, rather than there being a specific section on them.
A discussion about looting and how satellite imagery has been used to identify looted sites
Some short fictional stories, as a fun way to get the reader into a particular context.
An introduction to crowd sourcing space archaeology and the story of GlobalXplorer.
I spent my last vacation in Malta with my mom and husband. During our trip we explored various areas of the island, and were treated to archaeological sites ranging all the way back to 3500BC. This post summarises some of the computational archaeology that I read about along the way.
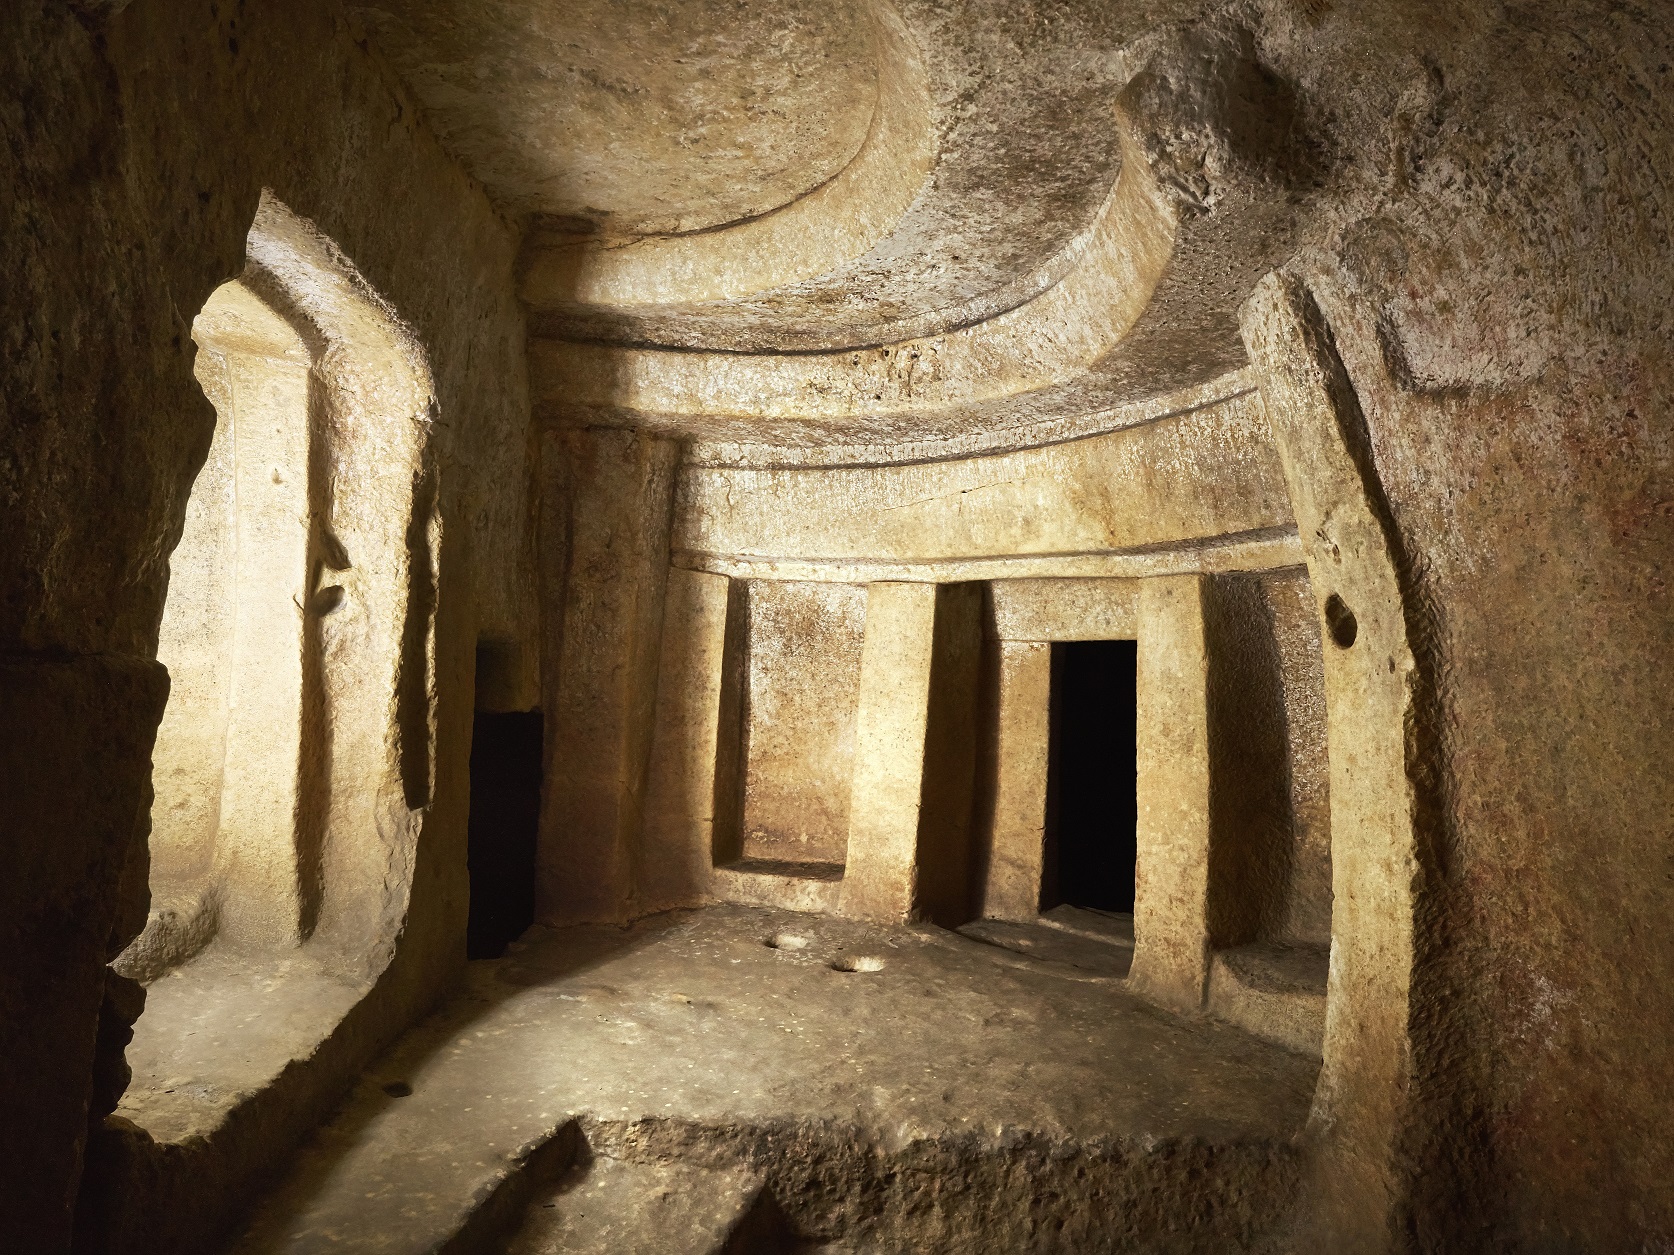
Ħal Saflieni Hypogeum: This is a neolithic subterranean structure dating back to 3300BC, considered to be one of the best preserved examples of a Maltese temple . It is located in Paola, Malta and has been thought to have been a sanctuary and necropolis.
Scientists create 3D computer model of hypogeum: Shows a video of how scientists have created a 3D model of the Hypogeum in order to predict the airflow within its chambers. This is measured in order to help preservation efforts against damage caused by people, temperature alterations and humidity changes. You can find the related paper here.
3D model of the sleeping lady: The sleeping lady is the most famous figure retrieved form the Hypogeum. This is a link to a 3D model of it
Archaeoacoustic Analysis of the Ħal Saflieni Hypogeum in Malta: The walls of the Hypogeum have certain ‘holes’ that were used to make the sound of someone’s voice travel throughout the structure. This paper describes how scientists used high end microphones to record a voice and various instruments through the crevice, in order to perform a detailed analysis of the acoustics.
Maltese Prehistoric Sites and Collections: A general paper about the modelling of various Maltese temples, including the Tarxien temples, and the figures found among them.
Hagar Qim Temples: These are megalithic temples dating back to 3600BC, making them among some of the most ancient religious sites on earth. They are located close to the sea, at Qrendi, Malta.
Venus of Malta: This article describes the 3D modeling of a figure, Venus of Malta, found at the Hagar Qim temples.
3D model of Phoenician shipwreck: Shows a 3D model of the pottery found from a Phoenician shipwreck. It seems that this is related to the Xlendi Wreck mentioned below.
Integrated 3D Geomatics for Archaeology: Case Study Malta: This article describes the use of digital aerial photogrammetric restitution, advanced SBAS GNSS and robotized total station measurements in the analysis of the Valley of Bidnija and Burmarrad.
Digging up stories untold: This article describes the use of a drone equipped with LIDAR in order to model the changing landscapes of Malta over time. The goal ultimately is to connect our modern views with what the prehistoric temple builders would have experienced.
All in all, the archaeologists in Malta have been quite busy mapping, modelling and preserving the various sites that are on the island, as well as underwater in their vicinity. There is a plethora of different types of archaeological sites within the island, ranging from neolithic structures and roman sites to world war shipwreck. This makes it a very interesting place for archaeological research.
Yes, it’s been more than a year since my last post. It’s time to get this blog going again! I am sorry for my absence.
I’ve been following the Artificial Intelligence, Machine Learning and Deep Learning in Archaeology Conference that took place in Rome remotely via Twitter. I had to do it remotely as I only found out about it when it had already started. This post aims to bring visibility to the conference in order for people like me to get an understanding of what kinds of work were presented ( and to not to miss it next time 🙂 ).
The conference was organised by the British School at Rome and the European Space Agency and took place in Rome (<3) on the 7th and 8th of November 2019. You can check out some details on the ticket site and their website.
Programme
Traviglia, Arianna and Marco FiorucciGraph Convolutional Neural Networks for Cultural Heritage: Applications in RS recognition, numismatics and epigraphy
Gattiglia, Gabriele, and Francesca AnichiniArchAIDE: A Neural Network for automated recognition of archaeological pottery
Tziotas, Christos Machine Learning for the Classification of Stone-Age Artefacts
Palomeque-Gonzalez, Juan F. Techniques of Machine learning for sex determination in human remains: When more advanced doesn’t mean better
Brandsen, Alex, Karsten Lambers, Suzan Verberne, and Milco Wansleeben Using Machine Learning for Named Entity Recognition in Dutch Excavation Reports
Evans, Damian Tracing Large-Scale Archaeological and Environmental Legacies of Tropical Forest Societies
Graham, Shawn and Damien Huffer Digital Phrenology? An Experimental Digital Archaeology
Sommerschield, Thea and Yannis AssaelRestoring ancient text using deep learning: a case study on Greek epigraphy
Moreno Escobar, Maria del Carmen and Saul Armendariz Historical landscapes and Machine Learning: (Re)Creating the hinterland of Tarragona, Spain
Schneider, Agnes Learning to See LiDAR Pixel-by-Pixel
Somrak, Maja, Žiga Kokalj, and Sašo DžeroskiClassifying objects from ALS- derived visualizations of ancient Maya settlements using convolutional neural networks
Verschoof-van der Vaart, Wouter Baernd and Karsten LambersThe use of R- CNNs in the automated detection of archaeological objects in LiDAR data
Trier, Øivind Due and Kristian LøsethAutomated detection of grave mounds, deer hunting systems and charcoal burning platforms from airborne lidar data using faster- RCNN
Keynote Lecture by Barbara McGillivray Tracking changes in meaning over time: how can machines learn from humans
Chris Stewart Welcome to ESA/ESRIN
Keynote: Juan A. Barceló Big Data Sources and Deep Learning Methods in Archaeology: A critical overview
Remondino, Fabio, Emre Ozdemir, Eleonora GrilliClassification of Heritage 3D Data with Machine and Deep Learning Strategies
Kramer, Iris, Jonathon Hare, and Dave Cowley Arran: a benchmark dataset for automated detection of archaeological sites on LiDAR data
Chris StewartMachine Learning with Earth Observation for Cultural Heritage at the ESA Phi-Lab
Marsella, M.A., J.F. Guerrero Tello, and A. CelauroDeep learning for automatic feature detection and extraction on the archaeological landscape of Centocelle neighborhood in Rome using optical and radar remote sensing images
Karamitrou, Alexandra and Fraser Sturt Detection of Archaeological Sites using Artificial Intelligence and Deep Learning Techniques
Rayne, LouiseMapping Threats to Cultural Heritage of the Middle East and North Africa
el-Hajj, Hassan InSAR Coherence Patch Classification using ML: Towards Automatic Looting Detection of Archaeological Sites
Küçükdemirci, Melda and Apostolos Sarris U-net for Archaeo-Geophysical Image Segmentation
Linstead, Erik, Alice Gorman, and Justin St. P. Walsh Machine Learning in Space Archaeology
Orengo, Hector A., Arnau Garcia-Molsosa, Francesc C. Conesa, Cameron A. Petrie As above so below: artificial intelligence-based detection and analysis of archaeological sites and features at a continental scale
For more information you can check out the abstracts here.
You can also check out Tweets from @peterbcampbell and @DamienHuffer for updates on the day. Here are some highlights on the wide range of themes:
Remember Electric Archaeology (the blog mentioned here before + the lecturer of one of the courses also mentioned here)? Shawn’s research partner Damien was presenting their research at the conference 🙂
Speaking of Shawn, they are excited about archaeology in space too 😀
It wouldn’t be complete without some shipwrecks 😀
Started following this blog because of some 3D scanning articles? Fear not, there was some cool stuff around 3D models too
And for those that have been reading this blog for a while, Juan Barcelo, the writer of the computational intelligence in archaeology book, was there too 🙂
Yessssss, LIDAR data for the identification of Mayan structures ❤ remember those cool articles about how LIDAR lets you see through the vegetation?
And for the NLP fans, now you can reconstruct fragmented texts, who knows what interesting texts you can find now.
Hopefully you and I can find out about this in time next year to go listen to some super interesting talks 🙂
Recently I did a 2 week trip with a friend to Israel, Jordan and Egypt. During this trip we saw a lot of amazing archaeological sites, which will eventually feature on this blog. Today I want to focus on Petra, Jordan.
Petra is a UNESCO Heritage site in southern Jordan, which has made the list of the new 7 Wonders of the world. Previously known as Raqmu, Petra was a city built during the Nabataean Kingdom as a trading hub. Many of the structures in the city (including the tombs) have been carved into the face of the colourful rocks found in the area.
A photo of the Monastery from our tea drinking spot
I have previously mentioned the Zamani Project , which does 3D models of archaeological sites (mainly focusing on African sites). They have created 3D models of various buildings in the Petra complex, which can be found on their website. The models were done by performing a laser scanning survey, for which the documentation can be found here. The models available include:
You can also find a lot of information about the site on this website. The site includes information about each of the buildings, the events taking place as well as a live stream of the site (which I find a bit creepy considering that I never saw a sign at the place stating that you are being broadcasted to the world). The buildings and natural sites described include:
Bab al Siq – en route to the george, this area includes a variety of tombs and monuments.
The Dam – a Nabataean dam
The Siq – a george which was used as the main entrance to the city
The Treasury / Al Khazna – the most well known building in Petra (thanks to Indiana Jones movies). The actual function of the building is a mystery (ranging between temple, document storage, etc), but it was once believed to house a treasure, giving it the modern name of The Treasury.
The street of Facades – row of Nabataen tombs
The Theater – a Theater built by carving the rock into an amphitheatrical shape
The Urn Tomb, the Silk Tomb, the Corinthian Tom, the Palace Tomb, the
The Sextius Florentinus tomb – various tombs in the area
The Collonaded street – a street with columns later refurbished by the Romans
The Buildings, Pond and Gardens Complex – garden and pond
The Great Temple – The largest freestanding building in Petra
Winged Lion Temple – Discovered using sonar technology, this is a temple for the Nabataean goddess al-Uzza
Byzantine Church – The remains of the Byzantine occupation in the area, with well preserved mosaics
The Temple of Qasr Al-Bint – A first century BC temple
High Place of Sacrifice – A venue for religious ceremonies
The Farsa Valley – A lion carved on a rock face
The Garden Temple – Likely an old Nabataean water system
The Tomb of the Roman Soldier and Funeral Ballroom, the Renaissance Tomb – more tombs around the area
The Monastery – used for religious meetings and later used as a Christian chapel. People described it as a difficult hike, a sort of death trap. It really was not a difficult hike, so don’t miss it because of rumours! It is beautiful.
“Recovering the Humankind’s Past and Saving the Universal Heritage” is a Coursera course that will teach you an overview of archaeology and focus on the digitalization of cultural heritage using ICT (information and communication technologies). The course is organised by the Sapienza University of Rome and starts tomorrow (22nd January 2018).
This holiday I had the chance to finally visit Athens and it was beautiful. We had great weather considering it is January. As is tradition this lead to some research on how the various sites that we saw have been digitised.
The city is covered in ruins. We stayed in the area of Monastiraki, very close to Hadrian’s library and with a wonderful view of the Acropolis 5 steps from the entrance of the hotel. We were there for four days around new years so, unfortunately, some of the museums that we wanted to visit were closed (like the museum of the ancient Agora). We also got a chance to visit the island of Aegina for a day.
I personally didn’t see any references to computational archaeology this time. However, work in the area has deffinitely been done, as you will see in the following links, with some of my holiday photos sprinkled around:
3D model of Hadrian’s arch – This arch is close to the Acropolis, next to the temple of Zeus, each of its sides representing the city of Theseus and city of Hadrian respectively. The model is representative of the arche’S current state.
3D warehouse of buildings in ancient athens – a warehouse of individual 3D models for different ruins within Athens. This is a collaborative platform so you can add your ow models if you have any.
3D model of Aphaea temple in Aegina – moving towars our trip to Aegina, I quite enjoyed visiting this temple. It is the temple of Aphaea, the goddes of fertility and the agricultural cycle. It is located in a beatiful are with a view of the sea on both sides and is not covered in tourists. The building is also quite well preserved.
Temple of Aphaea
Geophysical methods used for scanning bronze foundry – magnetometry (MAG), two- and three-dimensional electrical resistivity tomography (ERT), as well as two- and three-dimensional ground-penetrating radar (GPR) used to survey the Acropolis sanctuary, around bronze production site, in search for additional production sites.
Freely downloadable photographic archive of Agora objects – The Agora was the gathering place for the community. Athens has two Agoras. The first and main Agora which is now the name used to refer to a large archaeological site that includes the restored Agora, which is now a museum. The second is known as the Roman Agora and was, as the name states, built during the Roman period.
In addition to the above sites we also visited the following interesting sites for which I couldn’t find a dgital project:
Hill of Kolona – a site containing a prehistoric Acropolis, the remains of the temple of Apollo and the ruins of an ancient Sinagogue.
Hill of Kolona
Medieval village of Paleachora – The remains of a medieval village, hidden on a hill from pirates, of which pretty much only the churches remain. There are little churches all over the place and a castle at the top of the hill.
Village of Paleachora
Lastly, for the pottery enthusiasts: The hill of Paleachora is covered in surface pottery pieces. If you enjoy spotting these it is a nice place to do it. Here is a picture my favourite find (Plese remember to leave them where you found them if you visit!):
I just came back from a nice 2 week holiday in Italy, where I was spoiled with archaeology, art and sun (the latter not often seen in Berlin). We visited Napoli, Pompeii, Amalfi, Roma, Siena, Florence, Chianti and Pisa. Somewhere in between waiting for late/imaginary buses and drinking wine, we managed to see some incredible archaeological sites. This post tries to dig a bit deeper into the computational archaeology work done in the larger two of these sites, namely Pompeii and the Roman Forum (including the Colosseum).
Pompeii
Pompeii was an ancient Roman town located in the west of Italy near Mount Vesuvius. The town was subject to common tremours, but was damaged significantly during an earthquake in AD 62. The citizens were repairing the damaged town when Mount Vesuvius, the nearby volcano, erupted in AD 79, killing the inhabitants and leaving the town in the state that popularised it as a touristic and archaelogical site upon rediscovery.
Photo from my visit – Homes and Vesuvius in the background
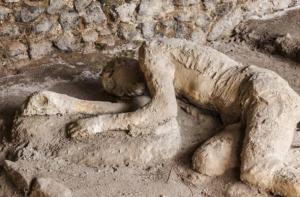
Visiting Pompeii has been in my wishlist for a long time and it is a place that I would like to visit again. This incredible archaeological site was discovered in 1748 and it is so large that it is still being excavated. It contains homes, roads, an amphitheater, water systems, a Gymnasium, etc. Some of the mosaics and frescoes decorating the buildings have been well preserved. Additionally, due to the unique layer of ash created by the lava covering Pompeii, the famous casts of the human remains of Pompeians can be created using a resin. This is possible because the lava solidified over the body and as the body decomposed, a void was created between the layer of ash and the remaining human bones. A transparent resin is then injected into this void, creating a cast.
Pompeii is one of the sites that I have mentioned in this blog before as technology has often been used to analyse and present it. Here is some of the computational archaeology work that has been done for Pompeii:
Google maps street view – I have mentioned this in a previous post about Google maps mapping archaeological sites. You can now explore Pompeii (and other sites) via the commonly used Google app. In the link that I have added you should be able to walk around and also see to your left the pottery and casts discovered.
3D models created by laser scans – Allow people to explore Pompeii virtually. The link provided will take you to an article that links to the project as well as to some raw 3D models.
CT scans of Pompeii victim casts – X-rays allow scientists to analyse the remains of Pompeii victims without destroying the casts that preserve their last moments. These scans are also being used to create 3D models of the remains and casts.
iPads used by archaeologists to document excavations – Also something mentioned before in this blog. Archaeologists often have paper based systems to document each step of their excavations. Pompeii archaeologists started using iPads in order to improve the recording of data.
3D modeling using aerial imaging – Drones were used to capture areal images of Pompeii, which were used to generate a 3D model for an interactive Journey through the ruins.
The Roman Forum and the Colosseum
The Roman Forum refers to a set of Roman Ruins in the center of Rome which includes a large number of structures ranging from government buildings to temples. This is located near the Colosseum and was the center of life in ancient Rome. The Forum was abandoned following the fall of the western Roman empire and was slowly despoiled.
The Roman Forum contains a senate house, government offices, royal residences, tribunals, temples, memorials, statues, etc. This too is quite a large site. considering that it is in the middle of a modern city.
Roman Forum during my visit
Here is some of the computational archaeology work that has been done for the Roman Forum and Colosseum:
Spectrometry used to reveal colour at Roman Forum – Spectrometry allowed scientists to determine the colour used to paint a menorah on an arch in the Forum. The readings were also used to fine tune the 3D reconstructions mentioned above.
Google maps street view of Palatine Hill – this a hill next to the Roman Forum (part of the same tourist attraction), which has also been mapped by google maps.
Colosseum during my visit
That’s all for now. If you have not yet had a chance to visit these incredible sites, I hope that these 3D models and virtual tours can give you a glimpse into the ancient Roman towns. Of course, I also wish that one day you can experience them yourself too.